Processing...
` = "Chi-Square Test"`
Enter a value for all fields
The chi-square calculator computes the χ2 parameters for an table of data.
INSTRUCTIONS: Enter the following:
- (OB) Observed Values
chi-square (χ2): The calculator returns:
- (DF) Degrees of Freedom
- (χ2) chi-square value
- (Σc) Column Sums
- (Σr) Row Sums
- (ΣOB) Total Sum
How to Enter Data
Click on the text field for parameter OB. You can either upload a CSV file or manually enter rows of data where each observation is separated by a comma as follows:
17,47
22,38
41,58
The Math / Science
`"Expected Result" = ("Column Total" * "Row Total")/"Sample Size"`
`χ2 = sum(O^2/E) - sum(O)`
`"Degrees of Freedom" = (R-1)*(C-1)` if R≠1, then DF = C-1
Critical Values


Statistics Calculators
- Observational Stats: This function accepts a table (rows and columns separated by commas) of numbers and calculates observational statistics for any of the columns. This includes count, min, max, sum, sum of squares (Σx²), square of the sum (Σx)², mean, median, mode, range, mid point, rand, sort up, sort down, rand, population variance, population standard deviation, the sample/experimental variance, sample/experimental standard deviation.
- Simple Stats: This is also provides a full set of observational stats, but on a single row of numbers separated by commas. The observational stats include count, min, max, sum, sum of squares (Σx²), square of the sum (Σx)², mean, median, mode, range, mid point, rand, sort up, sort down, rand, population variance, population standard deviation, the sample/experimental variance, sample/experimental standard deviation.
- Frequency Distribution: This function lets you enter a string of numbers separated by commas, a low and high range and a number of bins. It then computes how many of the observations are in each of the bins between the high and low values designated.
- Paired Sample t-test: This computes the various parameters associated with the Paired Sample t-test.
- ANOVA (one way): The computes the F Score and details for one way analysis of variance for a nxm matrix of observations.
- (χ2) Chi-Square Test: This computes the Chi-Square value for an nxm array of data and provides the degrees of freedom.
- Linear Regression
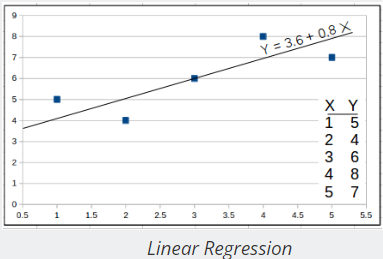 : This computes the regression line (least-squares) through a set of X and Y observations. It also computes the regression coefficient (r).
 - Least-squares Trend Inference : This is a linear equation used with Linear Regression to compute a predicted value of Y based on X.
- Wilcoxon Signed Rank Test: This provides the Wilcoxon statistics and critical value for two groups of numeric observations based on an alpha value and whether it's a one or two tailed test.
- Slope-Intercept form of a Line: This provides the slope intercept form (y = mx+b) of a line based on two coordinates.
- Slope between two points: This provides the slope between two coordinates.
- Linear Equation: This computes the range (y) of a linear equation (y = mx +b) and includes a graphing function.
- Probability between z SCORES:
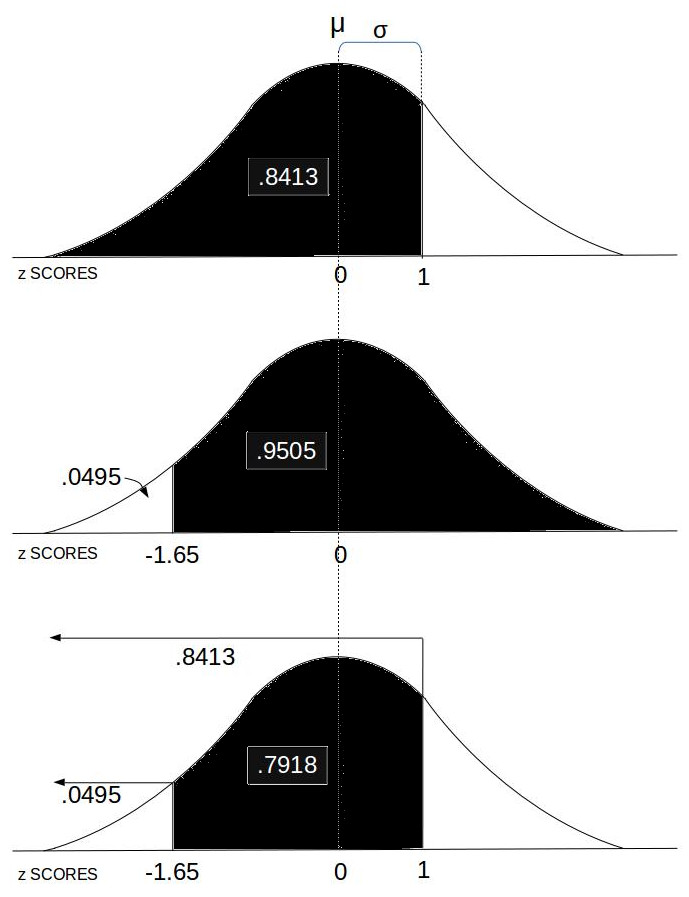 This computes the area under the Normal Distribution curve between two z SCOREs which equates to the probability of an event in that range.
 - Stats Calc: College level statistics calculator with a bundle including most of the functions in this list.
- Count: This computes the number (n) of observations in a set of numbers.
- Minimum: This computes the minimum (min) value in a set of numbers.
- Maximum: This computes the maximum (max) value in a set of numbers.
- Numeric Sort: This sorts (ascending or descending) a set of comma separated numerical observations.
- Random Sample (k items): The provides a random subset of a specified size (k) in a set of comma separated numerical observations.
- Random Real Number in Range: The provides a random real number between two specified real numbers (upper and lower bounds).
- Radom Integer: The provides a random integer between two specified integers (upper and lower bounds).
- Frequency Distribution: This provides a frequency distribution table for a comma separated set of numbers with a specified number of frequency bins between a lower and upper data range.
- Sum (Σx): This is computes the sum of the values in a set.
- Sum of Squares (Σx²): This computes the sum of the squared values in a set.
- Sum Squared (Σx)²: This computes the square of the summed values in a set.
- Mean (μ): This computes is the mean (average) of values in a set.
- Median: This identifies the middle ordered value in a set of numbers.
- Statistical Mode: This identifies the most recurring observation in a set of numbers.
- Mid Point: This is identifies the mid point of the observation range in a set of numbers.
- Range: This is computes the difference between the max and the min values in a set of number.
- Population Variance (σ2): This computes the variance, a metric regarding the spread of values, for a population set of numeric values.
- Population Standard Deviation (σ): This computes the standard deviation for a population set of numeric values.
- Sample Variance (s2) : This computes the variance, a metric regarding the spread of values, for a sample set of numeric values within a greater population.
- Sample Standard Deviation (s): This computes the standard deviation for a sample set of numeric values within a greater population.
- z SCORE Formula: This computes the z SCORE for a value base on the mean and standard deviation.
- z SCORE: This computes the z SCORE for a value (Raw Score) based on a set of values, and whether that set is sample or population.
- Percentile: This computes the percentile of a value (y) in a set (X) of values.
- Standard Deviation of Mean (SDOM): This computes the standard deviation of mean, sometimes also known as the standard error of the mean (SEM), useful to helps quantify the uncertainty in the estimate of the mean.
- Percent Relative Standard Deviation (%RSD): This computes the percent relative standard deviation, also known as the coefficient of variation (CV). The %RSD is a measure of the dispersion of a probability distribution.
The Psychology and Statistics Calculator contains useful tools for Psychology Students. The psychology statistics functions include the following:
- Wilcoxon Signed Rank Test: Enter two sets, whether it's a one or two tail test and an alpha value to see the Wilcoxon statistic and the critical value.
- Bayes' Theorem for Disease Testing: Enter a base rate probability, probability of false positives and the probability of correct positives to see a ratio of people with the disease, approximate number of false and true positives and the theorem's percent likelihood of a having the disease if tested positive.
- chi-square Test: Enter a 3x2 matrix to see the expected values matrix with row and column totals, degrees of freedom and the chi-square value.
- Rescorla-Wagner Formula (alpha and beta version): Enter salience for conditional stimuli, rate of unconditional stimuli, maximum conditioning for unconditioned stimuli and the total associative strength of all stimuli present to see the change in strength between conditional and unconditional stimuli.
- Rescorla-Wagner Formula (k version): Enter Maximum conditioning possible for the unconditioned stimuli, total associative strength of all stimuli present, combined salience of the conditioned and unconditioned stimuli, and number of trials to see the change in strength associated with the trials.
- Ricco's Law: Enter the area of visually unresolved target and constant of background luminance when eyes are adapted to see Ricco's Law factor.
- Ricco's Law (K variable): Enter the scotopic vision constant, background luminance and photopic vision constant.
- Stevens' Power Law: Enter proportionality constant, magnitude of stimulation, type of stimulation exponent to see magnitude of sensation.
- Weber Fraction: Enter just-noticeable difference for intensity and stimulus intensity to see the weber fraction.
- Weber-Fechner's Law: Enter just-noticeable difference for intensity, instantaneous stimulus, stimulus intensity and the threshold to see the factor.
- Random Integer: This provides a random number (integer) between a lower and upper bound.
- Observational Statistics (aka Simple Stats): Observational statistics on a set including: count, min, max, mean, median, mode, mid-point, range, population and sample variance and standard deviation, mean absolute deviation, standard deviation of mean, sum of values, sum of squared values, square of the sum, and the sorted set.
- Frequency Distribution: Frequency distribution of a set of observations in uniformly sized bins between a minimum and maximum.
- Least-squares Trend Line (aka Linear Regression): Linear regression line on a set of paired numbers and see (r) the correlation coefficient,(n) number of observations, (μX) mean of the X values, (μY) mean of Y values, (ΣX) sum of the X values, (ΣY) sum of the Y values, (Σ(X⋅Y) ) sum of the X*Y product values, (ΣX2) sum of X2 values, (ΣY2) sum of Y2 values, (a) y intercept of regression line, and (b) slope of regression line.
- Single-Sample t-test: t-Test parameters including alpha level, population mean and whether it's one or two tailed and see the degrees of freedom, critical t-value, t score and the standard error.
- Paired Sample t-test: Test of two sets of values with an alpha level and whether it's one or two tailed and see the number of observations, mean and standard deviation for both sets, the degrees of freedom, critical t-value, t-score and the Standard Error value.
- Effect Size (r-squared): Enter a t-test result and the degrees of freedom to see r2.
- Effect Size (Cohen's d): Enter the mean from two groups and the estimated standard deviation to see the effective size.
- Analysis of Variance (one way): ANOVA for numeric observations of three groups. Computes the F Score, Numerator: degrees of freedom Between, Denominator: degrees of freedom Within, mean of each group, grand mean, total sum of squares, sum of square within and between, and variance within and between.