Processing...
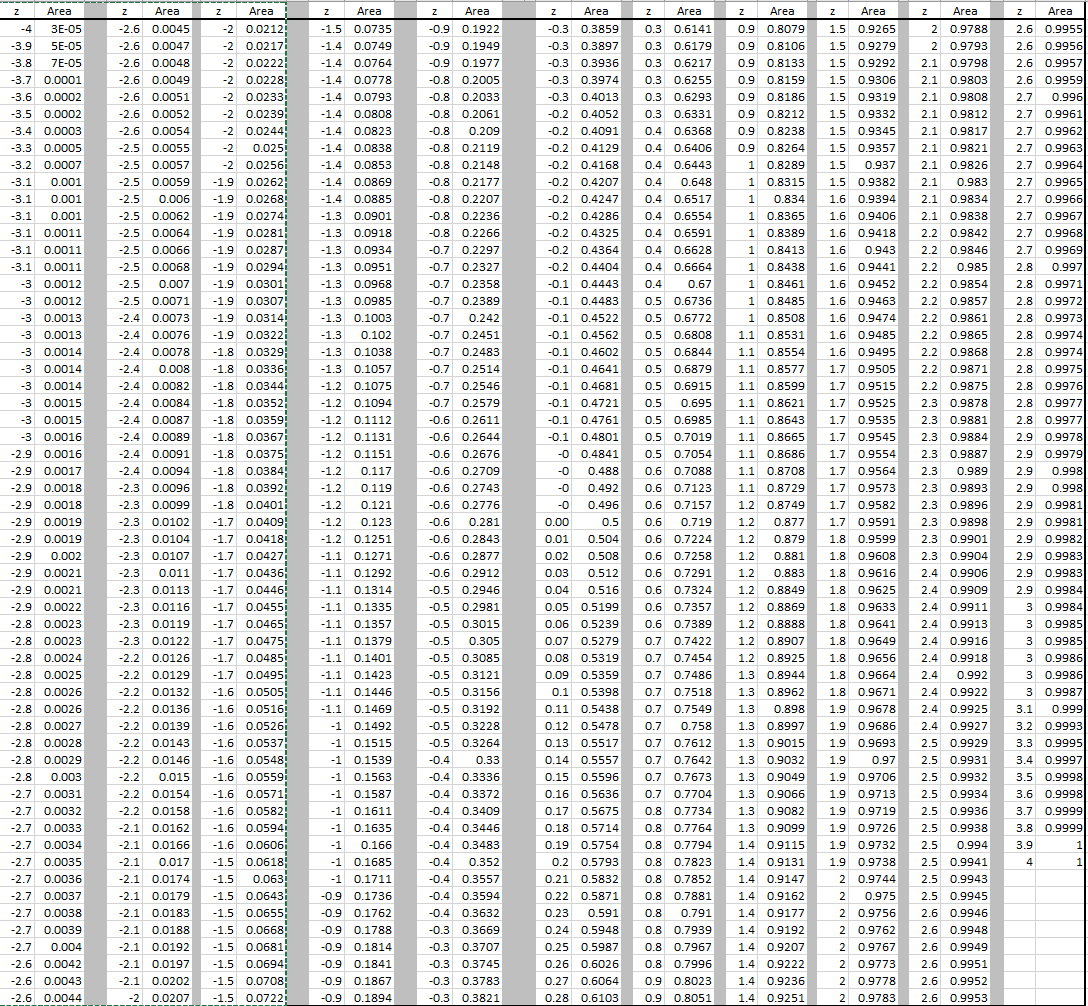
The zNorm table contains the z Scores and the area under the curve to the left of the z Score for a Normal Distribution. The table has values from z = -4 to +4 at increments of 0.01. This table was developed using Microsoft Excel and the NORMSDIST(z) function. 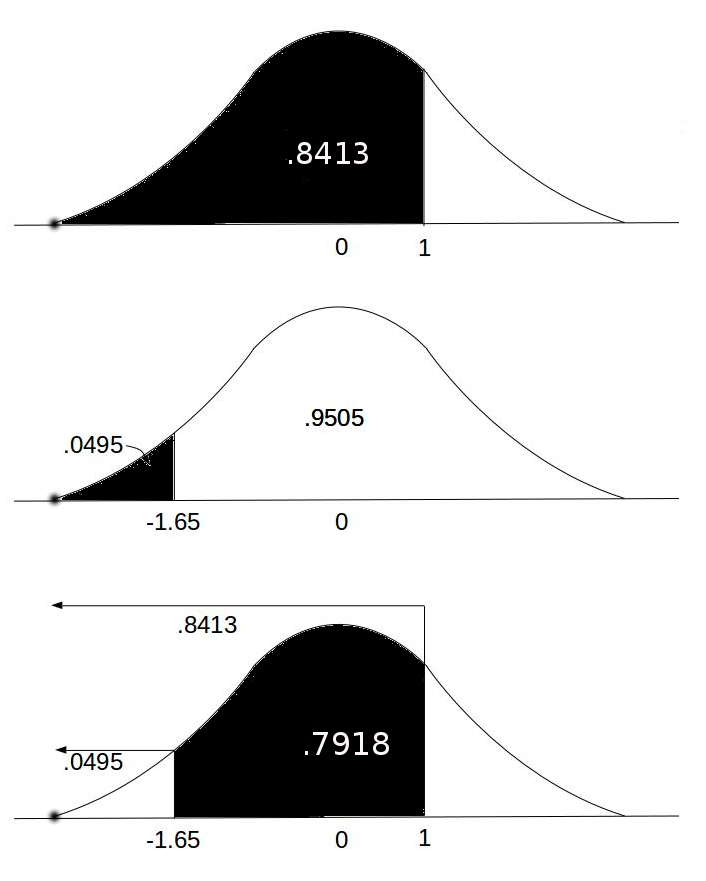 Probability & Normal Distribution This equates to the probability of an event with a lesser z SCORE:
- Compute the probability of less than a z Score in a Normal Distribution
- Compute the z SCORE based on the mean and standard deviation
- Compute the z SCORE in a set of observations
- Compute the percentile of a single observation (y) in a set (X)
- Sort a list of numeric values
- Create a random subset of the a list of numeric values
- College Level Statistics Calculator (Stat Calc).
The Math / Science
The z Score of a value (raw score) can be calculated when the population mean and population standard deviation. The formula for the z score is:
z = (x-μ) / σ
where:
- z = standard score
- x = raw score
- μ = population mean
- σ = population standard deviation